
In Last Simulation tab (Schedule)
This tab contains a graphic overview of all events and developments affecting objects in the model during the last simulation. As in the Inputs Tab, the x-axis represents time, but now each row in the y-axis generally stands for assets. All jobs and events related to a single object are placed in the same row; for example, you will see a Facility Expansion job appearing in the same line as the corresponding Facility Construction job.
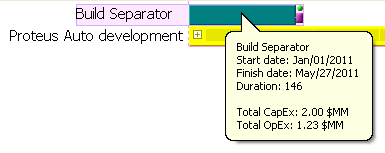
Detailed information about jobs and other items in the Schedule is available by left-clicking on them: Name of the job, Start and Finish dates, Duration and Total CapEx and OpEx:
Jobs with duration higher than one day are represented by the same bars used in the Inputs Tab; jobs with duration zero and other events, on the other hand, have their own code as follows:
 completion performed
  production started
  connected
  choked
  shut in
  drilling or completion deferred
  facility expanded
  Compression installed
 ESP installed
  Gas Lift installed
  Gas Lift activated
  Well decline manipulation
 Well production rerouting
  not performed / interrupted
  abandoned (facilities, wells, pipelines)
  abandoned (whole project)
Chokes are indicated on the facility to which the choked wells are directly connected. Note that this does not necessarily mean that the constraint that caused the choke (e.g. a capacity limit) is located at that facility: it may also have occurred downstream, and the excess state may have been scaled back to the first facility of the processing line. See Well Chokes.If for any reason the simulated duration of a job extends beyond the project end date, this will be indicated by means of a pink area labeled Beyond simulated time. Right-click contextual information will advise that the job was not completed (within the simulated time at least). Notice that in this case the incurred costs will belong only to the simulated period (see Costs):
.PNG)
Also, if a job's start date falls beyond the end of the simulation, the job will appear as not performed.
Commands Available (In Last Simulation tab)
The following commands are available by right-clicking on the pane:
- Options: Allows to further modify the layout. Available options are: Left justify Event Names, Show grid lines, Show chokes, Show deactivated jobs, and Don't expand macro-jobs with more than <n> jobs.
 Colors: Same as in the Inputs Tab.
  Font: Same as in the Inputs Tab.
 - View -

- Zoom In

- Zoom Out / Zoom to Fit: Same as in the Inputs Tab.
- View -

- Copy Schedule Image To Clipboard: Copies the whole schedule plus the timeline bar to the OS clipboard in two formats: as a Windows metafile (vector format file) and as a bitmap.
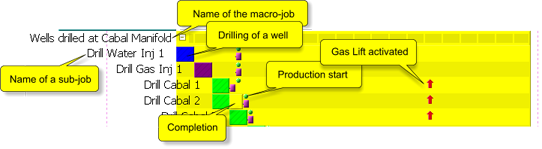
Wells drilled by means of a single macro-job or by Automatic Development or Infill Drilling jobs are presented by means of a collapsed yellow bar:

Expanding it by clicking on the  sign will show all these wells, together with any events affecting them:
Rig Usage
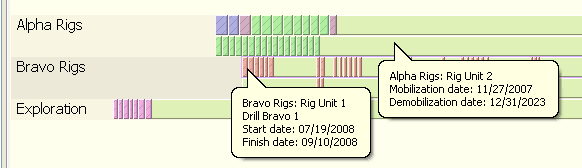
Rig utilization is also displayed in the pane below. Each row contains jobs performed by a different unit. The  lavender bar indicates periods during which the rig unit is mobilized but not performing any job. It starts the day the unit is mobilized and ends it is finally demobilized; seasonal demobilization is also marked by interruptions in the bar. (See Rig Seasonality.)
Left-clicking on individual job bars will display the following information: rig and unit involved, job performed, start date and finish date. Double-clicking on these bars will take you to the corresponding job node.
You can hide/show this pane by clicking on the cross on the bottom right, or using the Rigs command in the View Menu. By right-clicking on a row you can:
 Send Events to User Graph: Add the events of the selected rig unit to a User-Defined Graphs.
 Export to Excel: Export the events of all rig units to a MS Excel spreadsheet The data will be exported to an already opened spreadsheet (the last visited if there is more than one), or to a new spreadsheet if Excel is currently closed.
Display Bar
The bar at the bottom offers options for viewing the simulated timeline. The  Expand all /
  Collapse all buttons will expand / collapse all macro-jobs on the screen. Use the Job Selector to locate any job by name; if it is contained in a macro-job it will be expanded.

The buttons on the right, also present in the Inputs Tab, offer options for zooming in, zooming out,  showing the whole simulated timeline,
  selecting a region to zoom, or
  reversing to the previous view. This facilitates the display of details in large projects. You can also use the mouse wheel while pressing CTRL.
button once zooms the view to include all main jobs; clicking it twice expands the view to include all sub-jobs.